In this lesson you will learn:
-
How Neo4j Dashboards support your data reporting
-
How dashboards are constructed using cards
Introducing Neo4j Dashboards
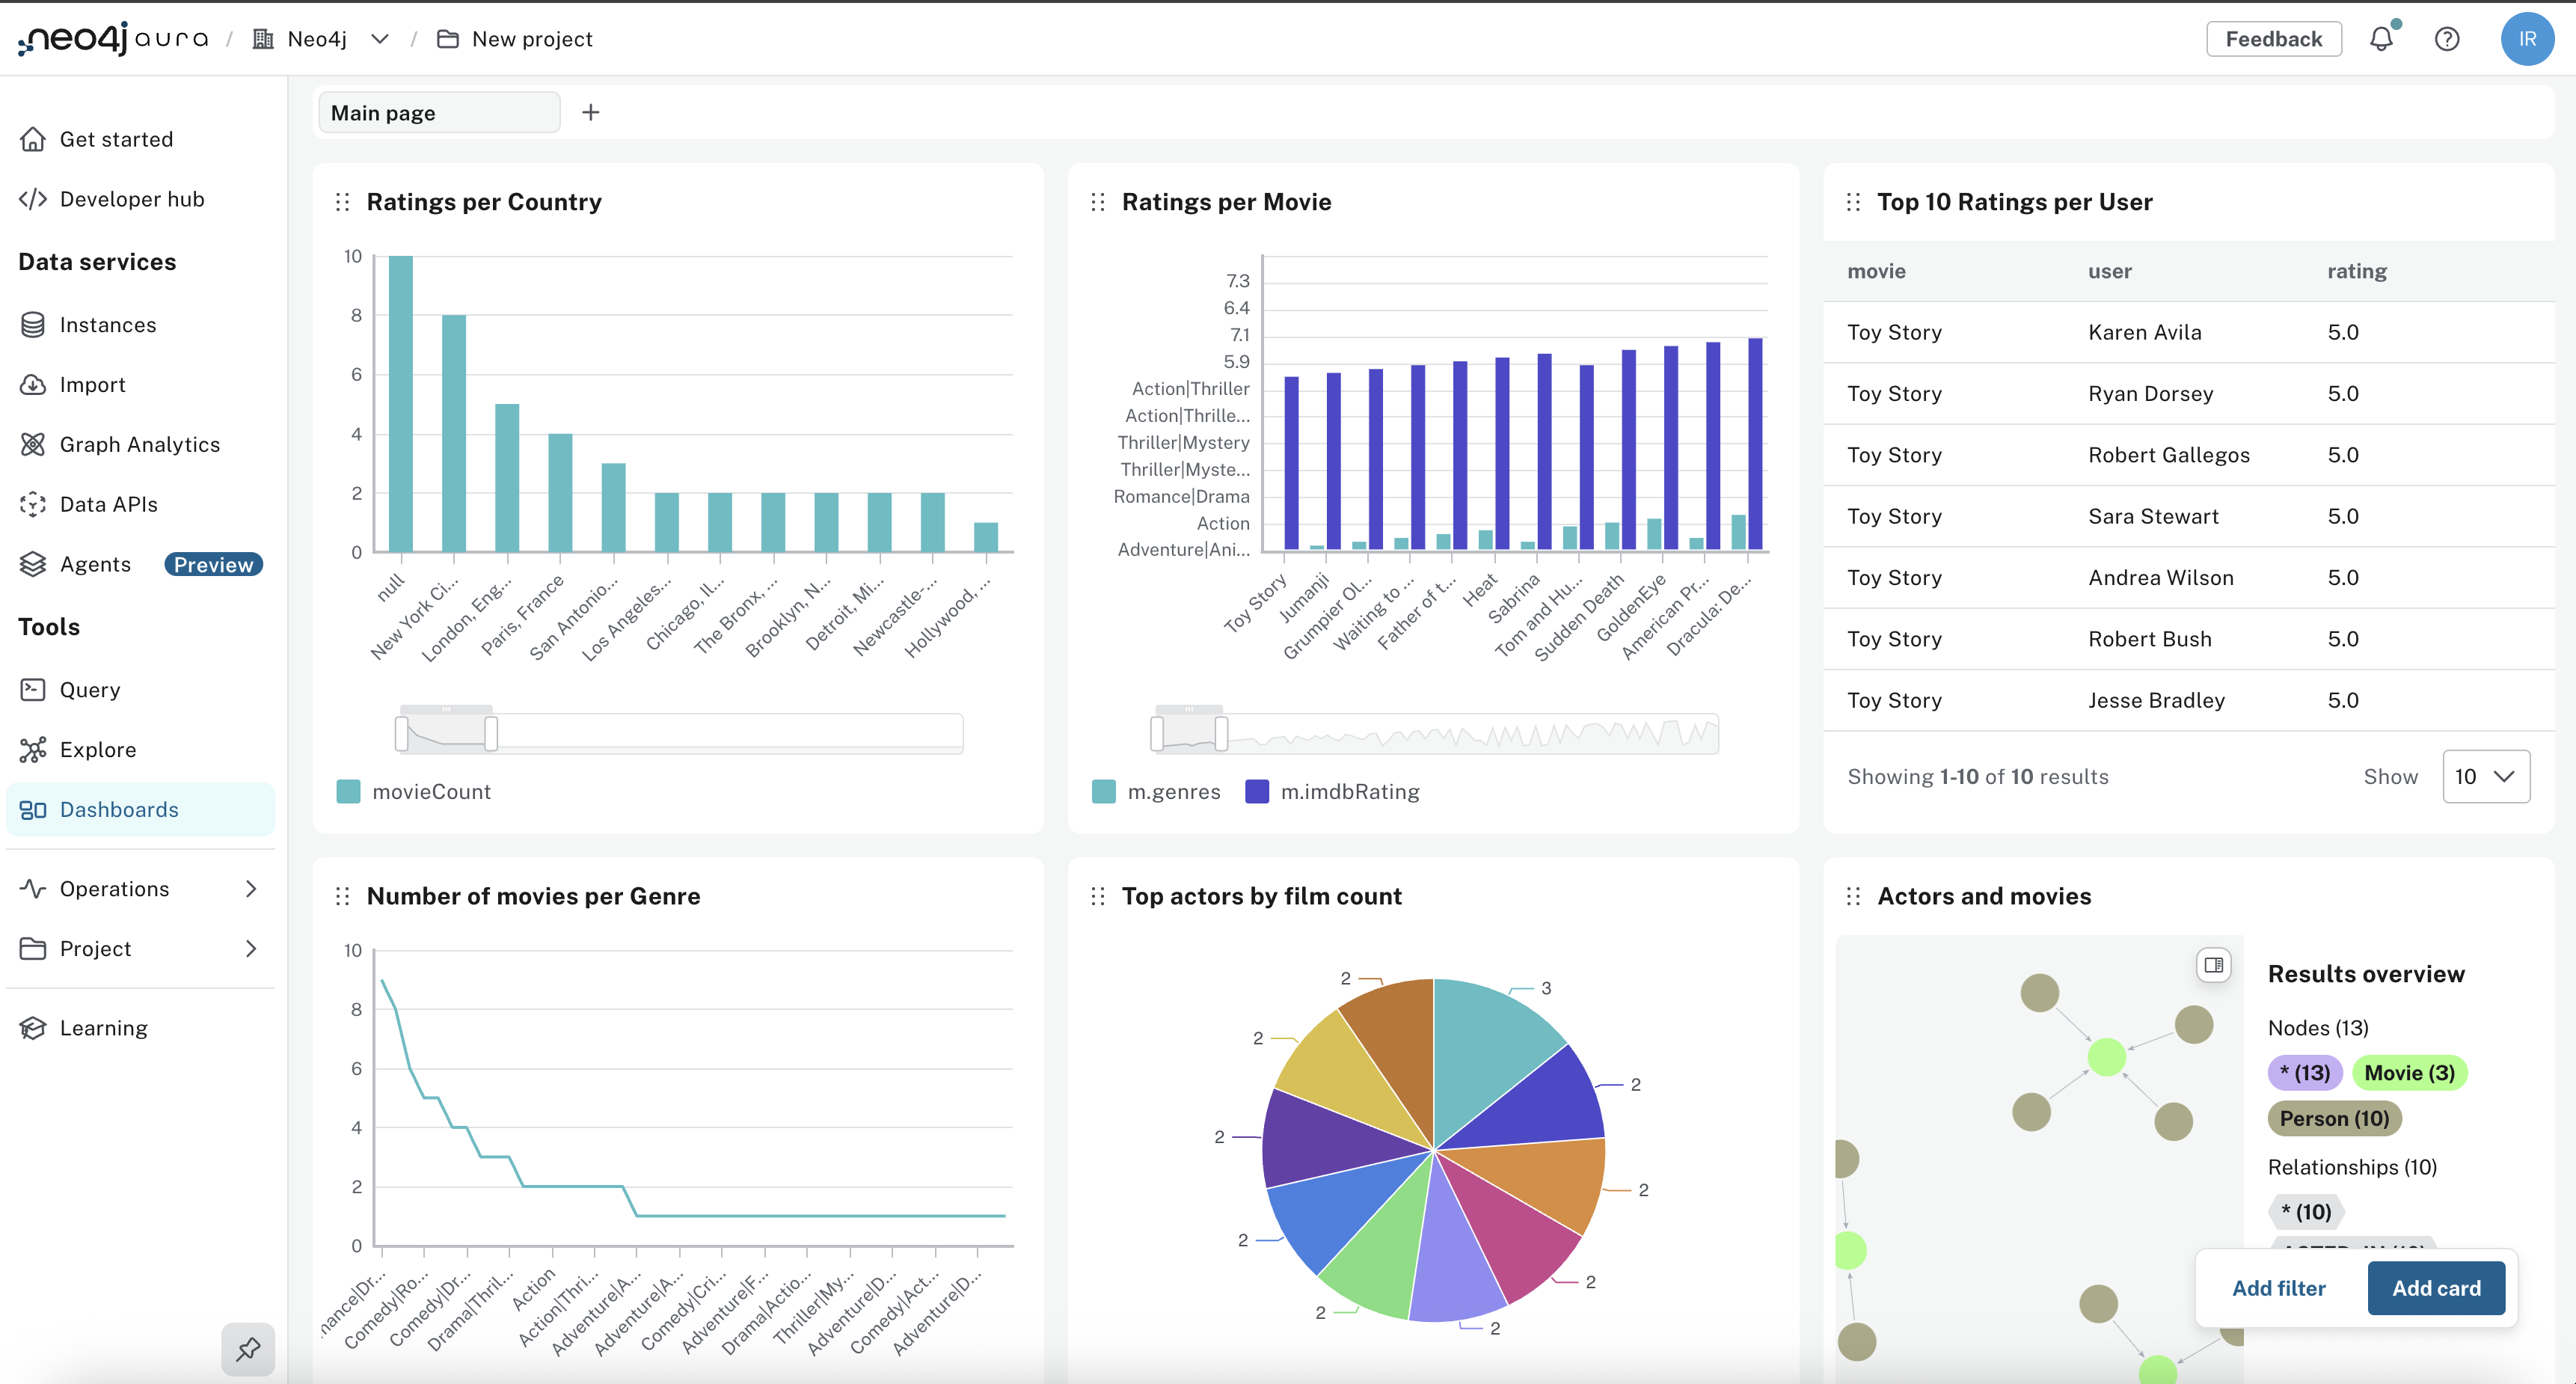
Neo4j Dashboards is a tool for visualizing and exploring your graph data.
Dashboards help you:
-
Visualize patterns and relationships in your domain
-
Monitor trends and compare categories or entities
-
Share insights with stakeholders
-
Explore data interactively without writing every query from scratch
-
Support decisions using charts tied to your graph
You will run queries and build dashboards using a movie recommendations dataset.
Dashboard cards
Dashboards are made of "cards". Each card has a type: a chart, number, graph, etc. Each type represents a particular metric or report.
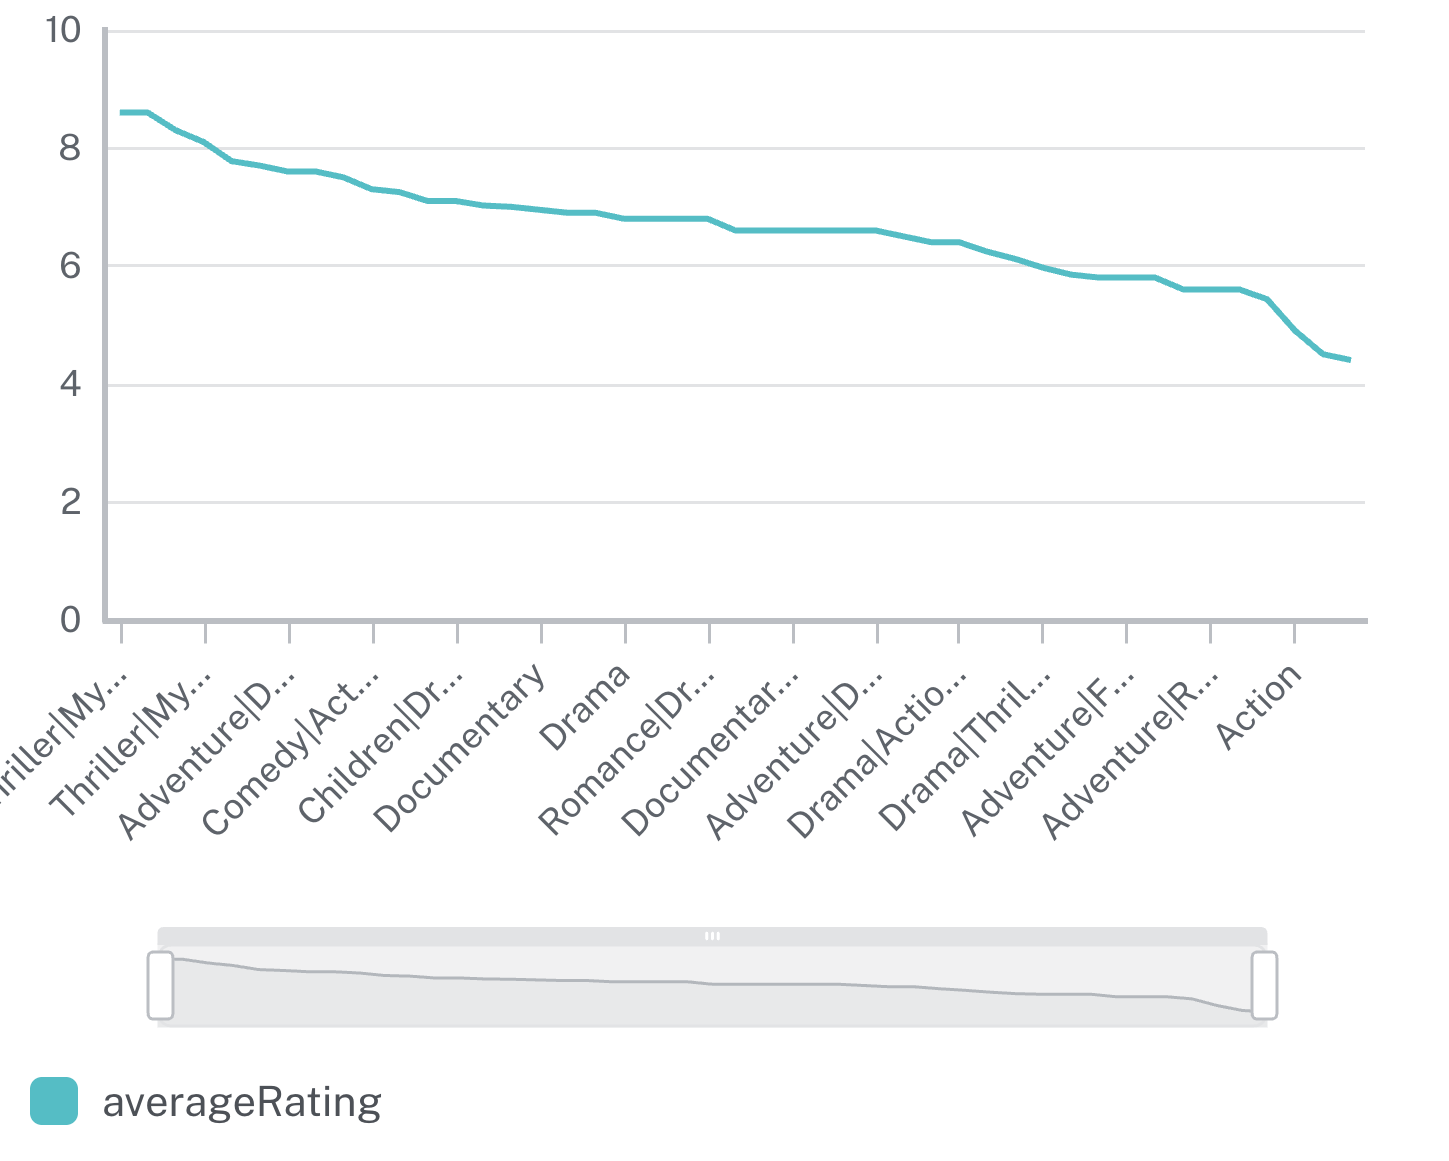
For example, a chart showing average movie rating by genre:
Creating cards with Natural Language
You can use Natural Language to create a card, describing what you want the card to show, for example, "Show average rating by genre" or "Visualize actor relationships". Neo4j Dashboards will generate the card, any required Cypher, and visualizations for you.
For example, create a card to "Show movies by decade":
New to Neo4j or Aura? Complete the the prerequisites for this course that cover graph concepts, Cypher, and the Console.
Before you connect
Quick checks:
-
Log in to Neo4j Aura. You can login with the same account as you use for GraphAcademy.
-
Identify Dashboards in the left nav—you will use it next.
-
If you want a sanity check, open Query, connect to your instance, and run
RETURN 1 AS ready.
Check your understanding
Purpose of Neo4j Dashboards
What is the main purpose of Neo4j Dashboards?
-
✓ Create visualizations of your graph data and share them with others
-
❏ Manage user roles and permissions in Neo4j instances
-
❏ Import large datasets into the Neo4j instance
-
❏ Use only natural language and not Cypher
Hint
Dashboards visualize graph data; you can share the result. You can use natural language and the AI generates Cypher, or you can write Cypher in the card editor.
Solution
Create visualizations of your graph data and share them with others.
Neo4j Dashboards lets you build cards from natural language, with the AI generating Cypher, or from Cypher you write. The main purpose is to visualize graph data and share those views with others.
Summary
You have learned about Neo4j dashboards and how they are created from individual cards.
In the next lesson you will add the example movie recommendations dataset to the Neo4j Aura console and connect Neo4j dashboards.