Dashboards are built on a graph data model. Understanding your graph model and reporting requirements will help you build better dashboards.
In this lesson you will learn explore how to analyze your graph data model and use it to design effective dashboards.
Understanding requirements
You should ask:
-
What are the main node labels and relationship types?
-
What properties do nodes and relationships carry? (For example, ratings live on
RATEDin the recommendations graph.) -
What questions do you want to answer with your dashboard?
-
Can you map those questions to the data in the graph?
-
What type of visualization will best answer those questions?
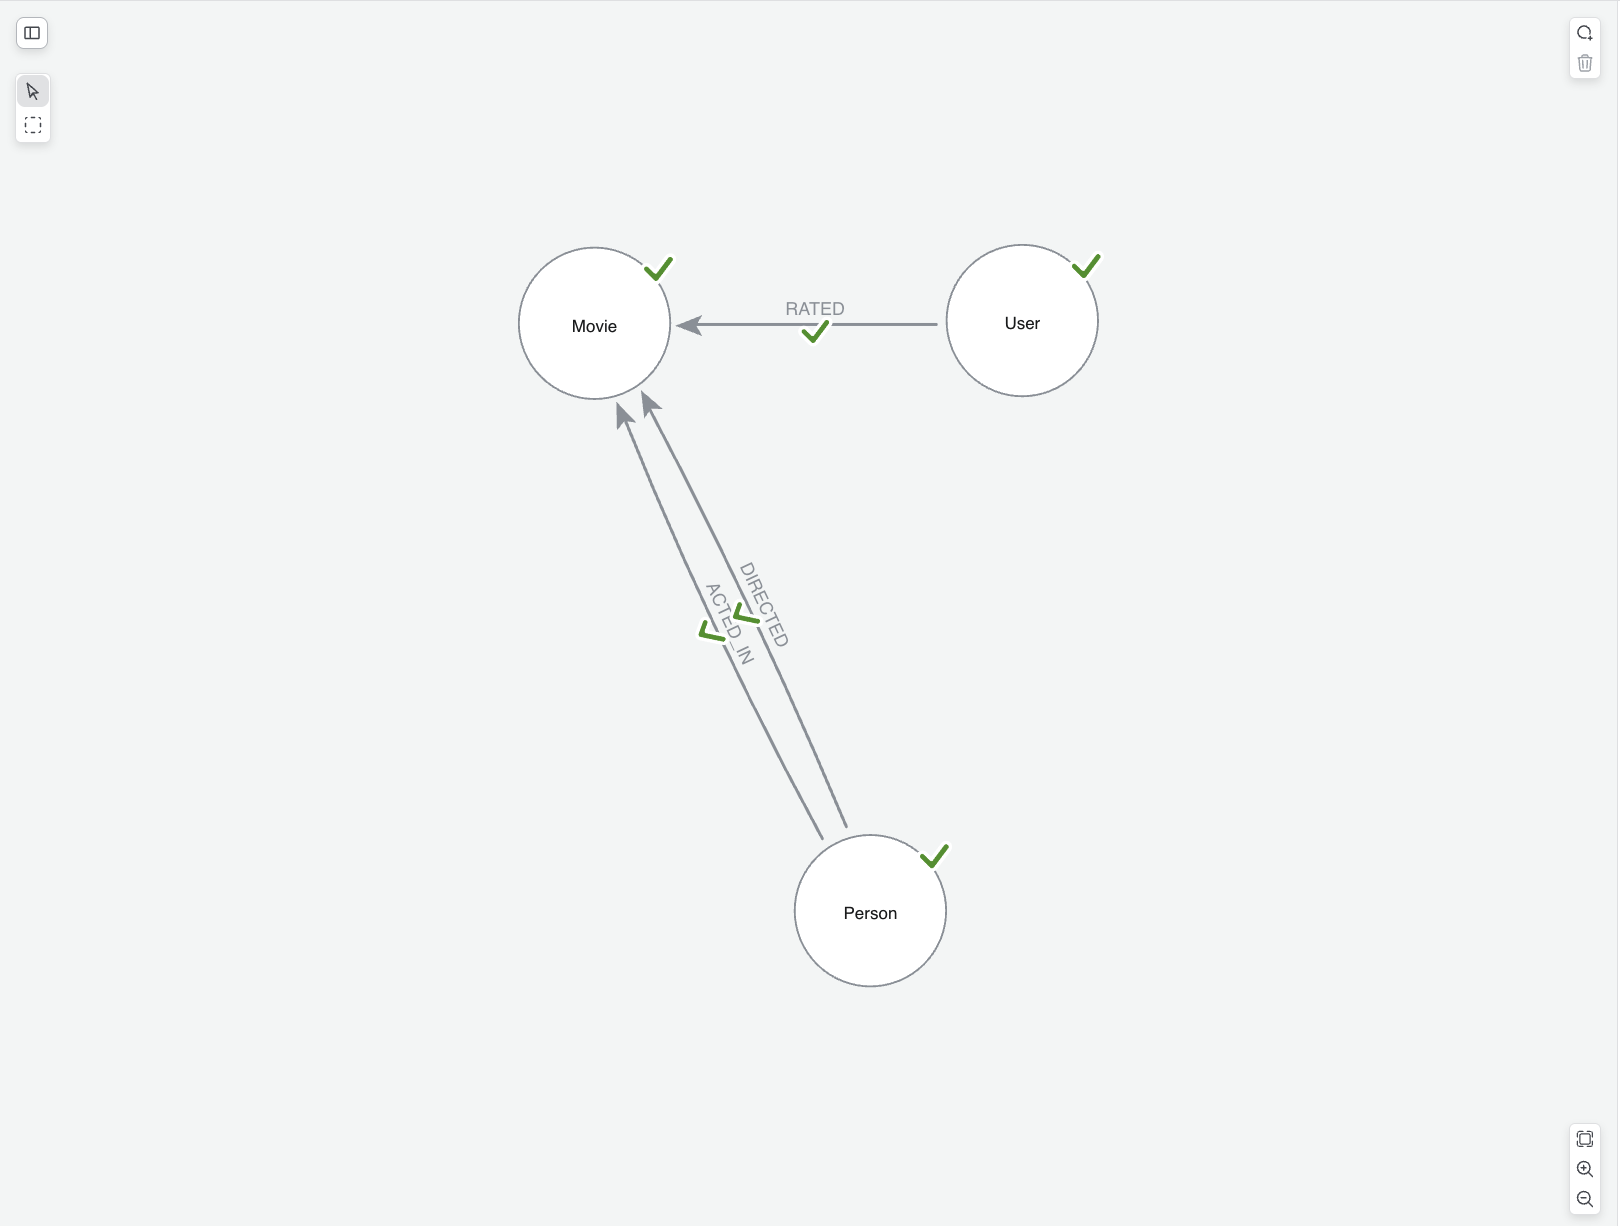
The movie recommendations data has the following graph model:
-
Labels:
Movie,Person(withActor/Director),Genre,User -
Types:
ACTED_IN,DIRECTED,RATED,IN_GENRE -
Properties: vary by node —
title,year,imdbRatingonMovie;ratingonRATED; and so on.
From questions to queries
When creating your dashboard, you will need to translate questions into Cypher queries.
If you were building a dashboard for a movie streaming service, you may already have some questions in mind that your dashboards should answer. Those questions can help you to define your graph data model. For example, you might want to answer:
-
Which genres have the highest average movie ratings?
-
Which genres are most popular among various demographics?
-
Which users contribute the most ratings for a given genre?
-
Which movies have the highest average ratings?
Each question hints at the underlying data model. To answer the questions above, you would use the following nodes and relationships = (User)-[:RATED]→(Movie)-[:IN_GENRE]→(Genre).
To find the top user rated movies, you could write this Cypher query:
MATCH (u:User)-[r:RATED]->(m:Movie)
RETURN m.title AS movie, avg(r.rating) as avgRating
ORDER BY avgRating DESC
LIMIT 10
Use Natural language to find the right query
You can used natural language to find the right query pattern. For example, you could ask: Which genres have the highest average movie ratings? and use the generated Cypher as a starting point for your dashboard card.
Some best practices for dashboard design:
-
Analyze your data model before adding many cards
-
Tie metrics to stakeholder goals
-
Be specific about labels and relationship types in prompts and Cypher
Check your understanding
Understanding your data model structure
You want to visualize how actors are connected to movies in the Movies graph. Which parts of the graph data model do you use to build that visualization?
-
✓ Nodes, which represent entities such as Movie and Person
-
✓ Relationships, such as ACTED_IN connecting Person to Movie
-
✓ Properties, such as title on Movie nodes and name on Person nodes
-
❏ Instances, which are database containers and not part of the model
Hint
A graph data model consists of nodes, which represent entities such as Movie and Person; relationships, which are connections such as ACTED_IN; and properties, which are attributes such as title and name. These components define what you can visualize in dashboards. Instances are where the data is stored; they are not part of the model structure.
Solution
The correct options are:
-
Nodes: Represent entities such as Movie nodes and Person nodes
-
Relationships: Define connections between nodes; for example, ACTED_IN connects actors to movies
-
Properties: Provide attributes on nodes and relationships, such as title on Movie, name on Person, and characters on ACTED_IN
These components define your data model and determine what insights you can visualize in dashboards. Instances are database containers where your data is stored, not components of the data model structure.
Summary
In this lesson, you explored effective dashboard design process and how your graph data model can inform your questions.